Correlation of Intensity to tangent direction
04-06/03
Shue model:
- Fit directly physical parameters
- Find maximum deviation of shue model and translate to maximum angle difference
- From 3D viewer take pictures for vatious angles and seasons. Focus on +-45 theta angles
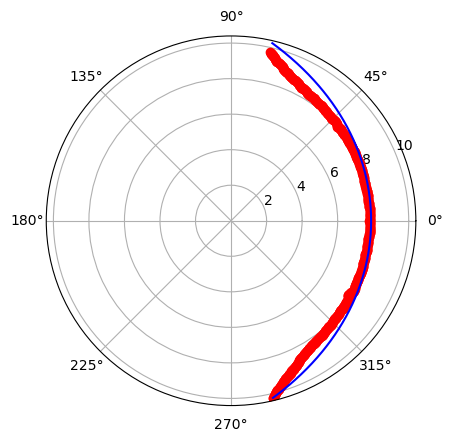
- Compare shue model with maximum intensity
Problems
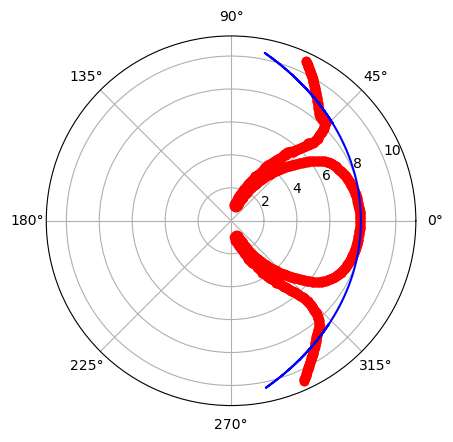
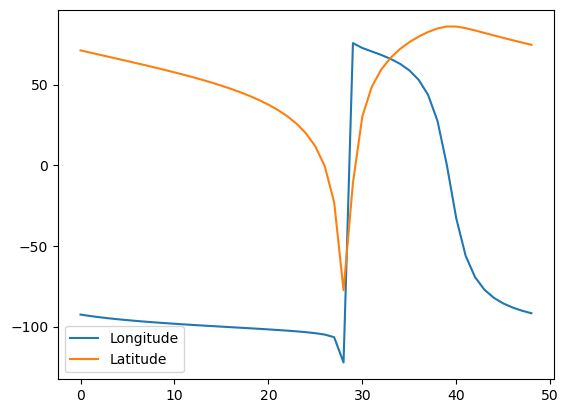
The higher latitude (right) which corresponds to a viewing direction close to the z axis (xy plane) has better agreement with the shue model. When the satellite approaches the y axis (left) there is no correlation with the curve. This means that even if we try to fit the shue model in the images, for some angles this will give very misleading results.
At the same time the maximum intensity doesn't seem to match wi
th the shue model position (even in the positions close to the z axis). Instead it seems to be closer to the second maximum and in between the two maxima:
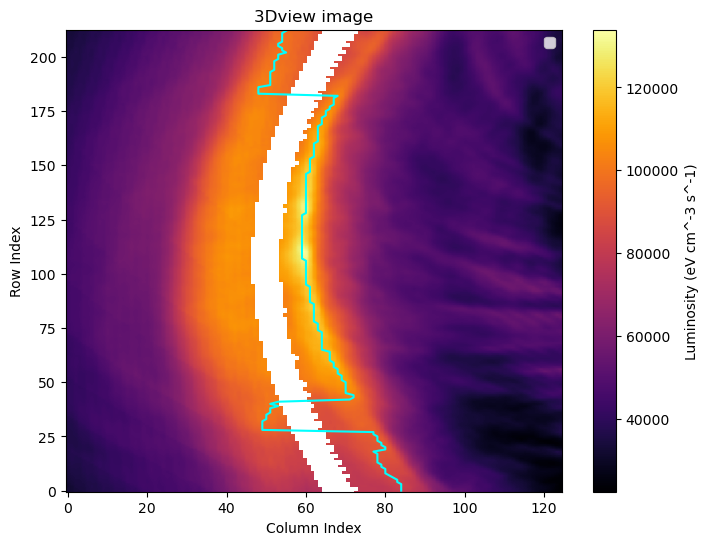
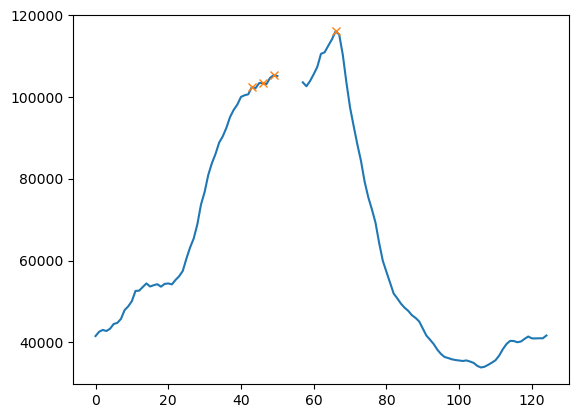
At the same time, extracting a smooth arc separetely for the maximum intensity, second maximum and local minimum, is not so straight forward. There are jumps in the curve tha need to be dealt with
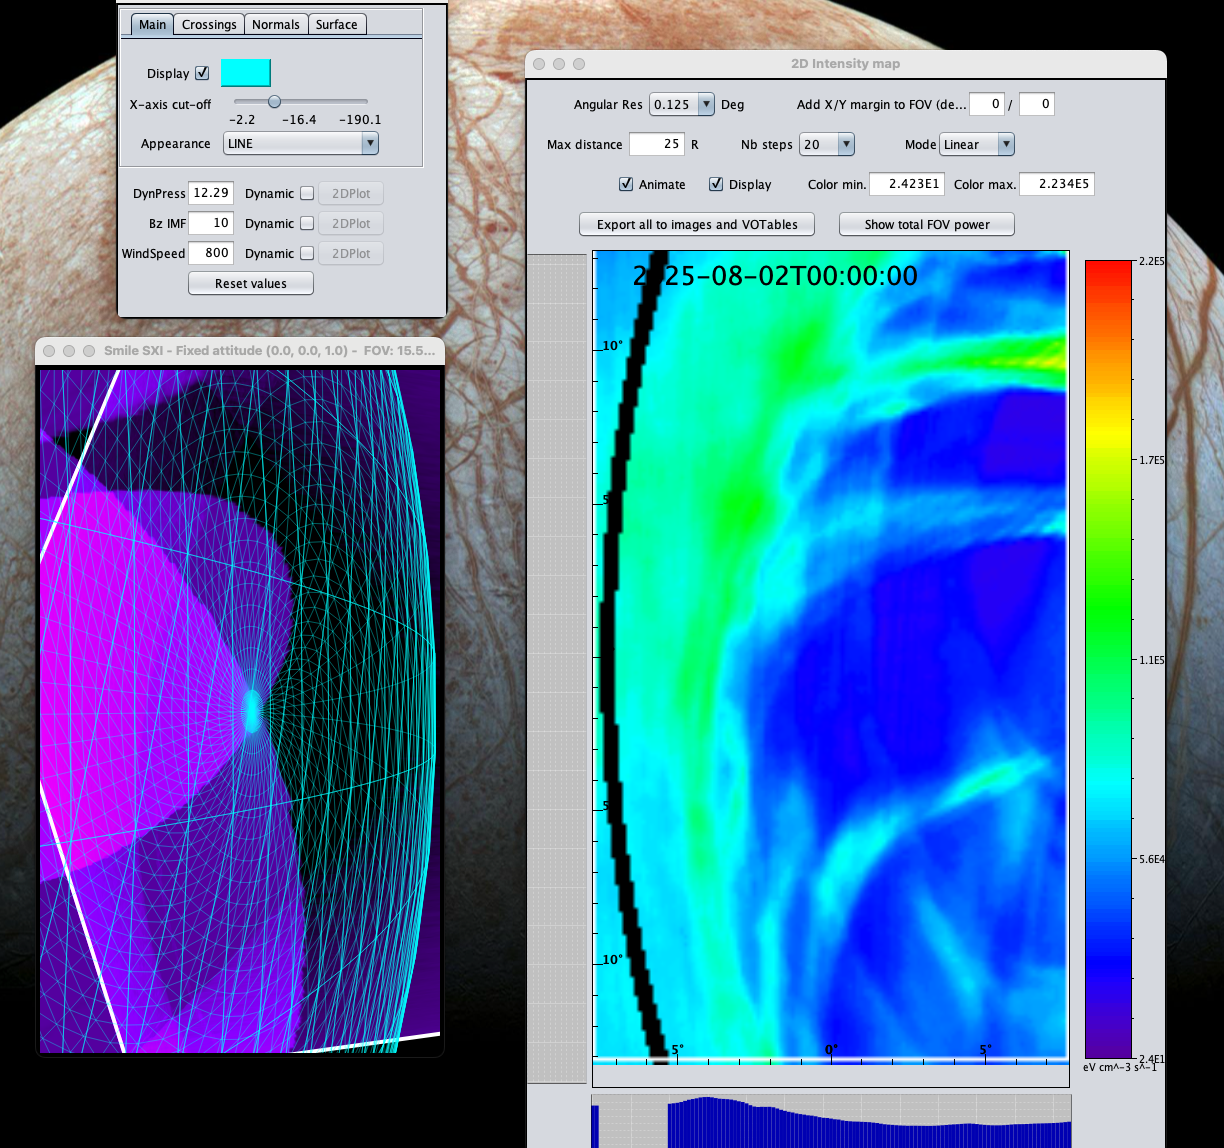
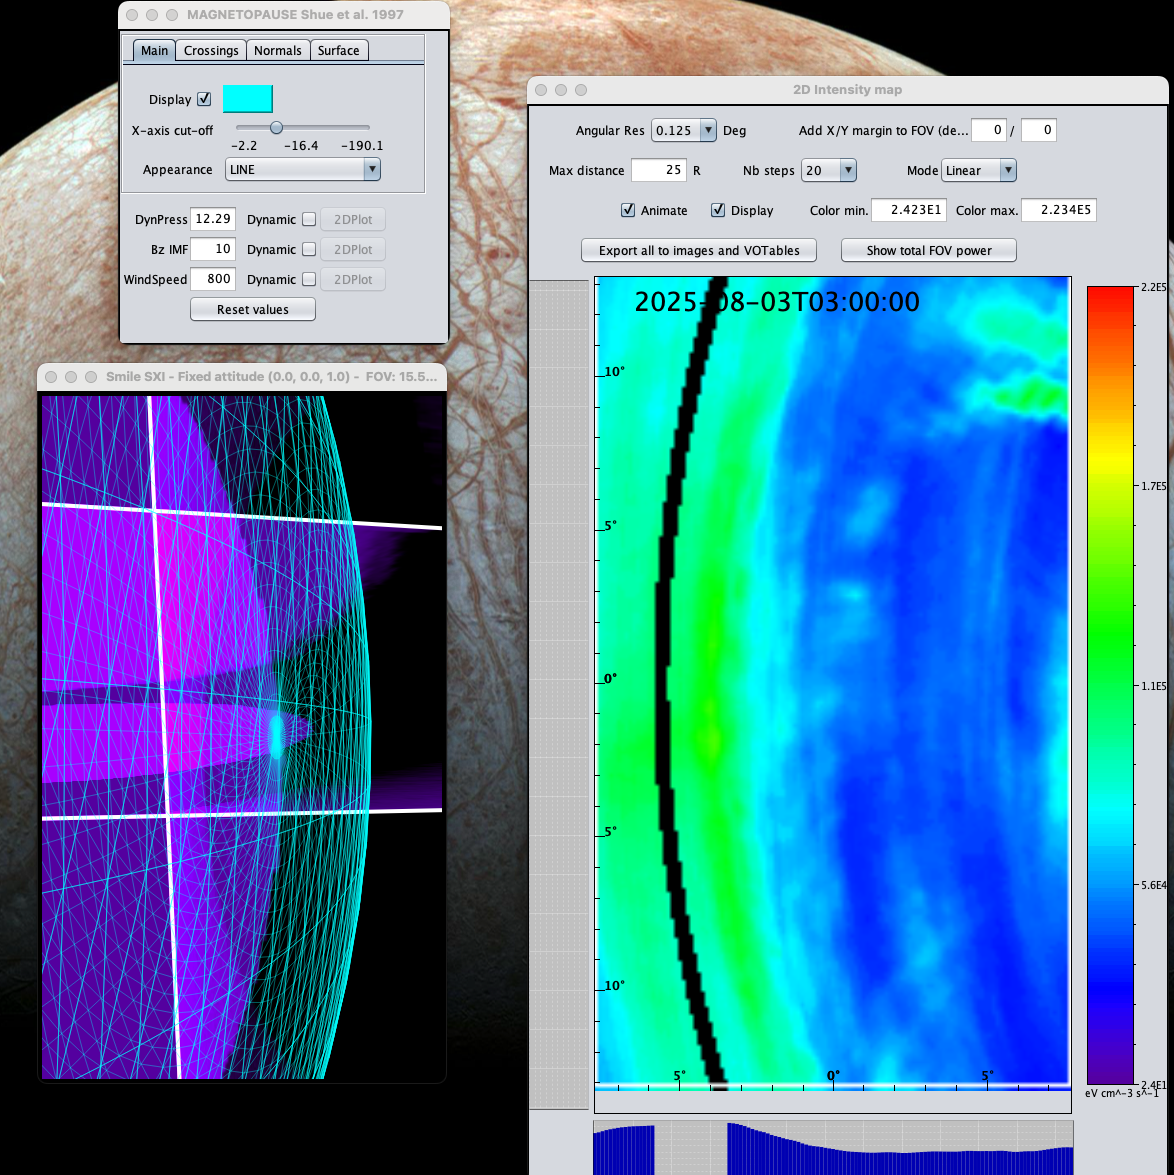
-- 3DView obscures the data of interest, on the projection of the shue model
When trying to extract separately the images without the shue mask, there are some simulation discontinuities that peak the value of specific pixels to the gods.
==> Arc detection
Solutions
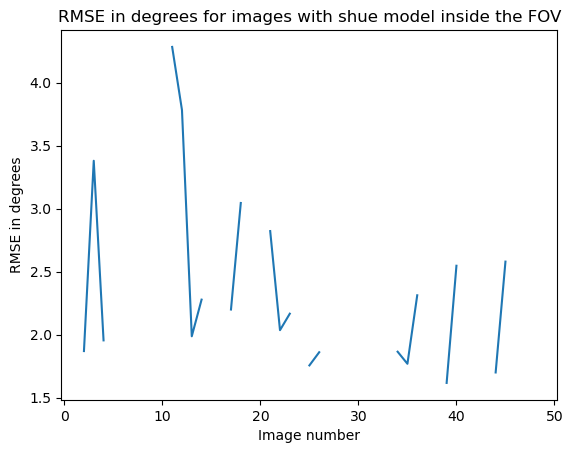
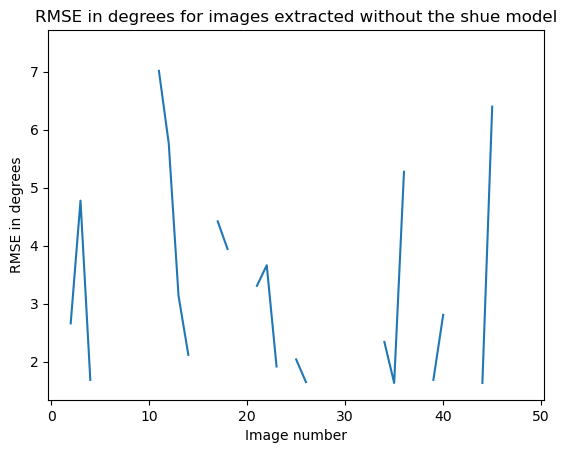
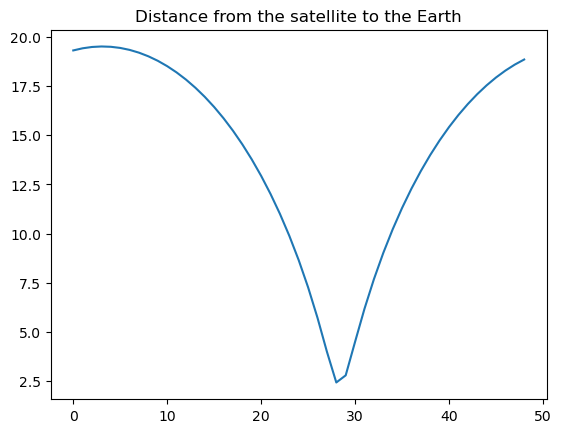
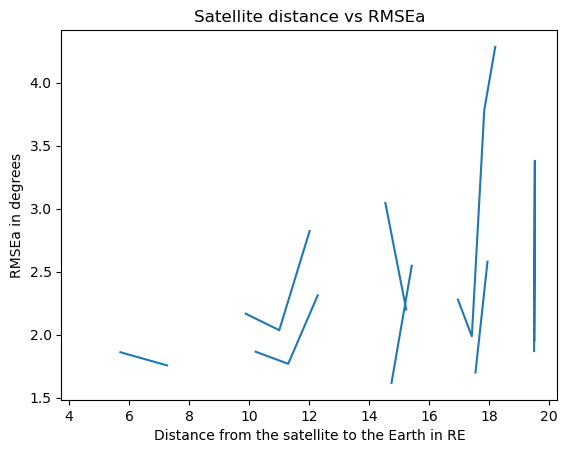
As a first step we can plot the standard deviation of the maximum intensity with the shue model with the change in satellite position. This can be done only in angles of the imager since we dont know in which distance we are projecting and we cannot translate it to RE.
It seems that glob.glob() returns the images in a random order so I was correlating random images with random orbits, oops...
In order to do that we need to actually fit the shue model to the images and compare that model with the initial one.
To fit the model to the images we need to first convert it to polar GSE coordinates in one plane. We return again to the same problem. How do we define the coordinate transformation from the SXI to GSE?