Cube and Image tests
3D cube emission
13-17/0225
Read the Production 3D cube and calculate the integration of emission over the three axis.
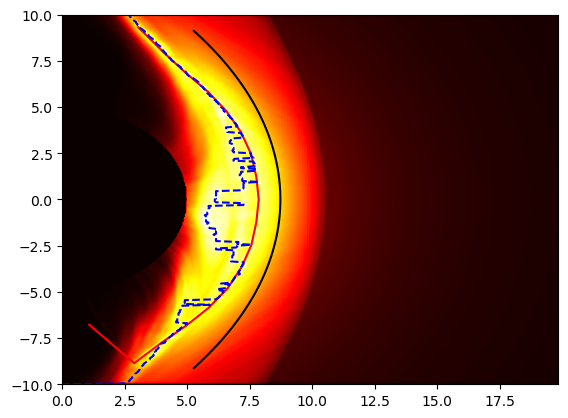
Z axis: Important contribution from the cusps, maximum intensity does not always correspond to magnetopause.
Model comparison: Shue model (black line) with input parameters B, v, n does not fit correctly to the model magnetopause. Extraction of MHD input model magnetopause by comparison of closed-open field lines in the equatorial plane (red line).
3D View images
18-19/02/25
- Take pictures from 3D View
- Export them as VOTables
VOTable is an XML-based format for tabular data endorsed by the International Virtual Observatory Alliance; while the tabular data which can be encoded is by design close to what FITS allows, it provides for much richer encoding of structure and metadata. Most of the table data exchanged by VO services is in VOTable format, and it can be used for local table storage as well.
Any table which conforms to the VOTable 1.0, 1.1, 1.2, 1.3 or 1.4 specifications can be read. This includes all the defined cell data serializations; cell data may be included in-line as XML elements (TABLEDATA serialization), included/referenced as a FITS table (FITS serialization), or included/referenced as a raw binary stream (BINARY or BINARY2 serialization). The handler does not attempt to be fussy about input VOTable documents, and it will have a good go at reading VOTables which violate the standards in various ways.
https://www.star.bris.ac.uk/mbt/topcat/sun253/inVotable.html
-- There was a problem with the format of the extracted VOTables and the outputted values where "--" instead of an array with the pixel values of the row. I wrote a script that adds the attribute arraysize="52" to the "values" field, and is now read properly. Should we report this error?
-- In the azimuth parameter, an extra space in the values results in the first value of the array to be NaN and the last to not be read.
</DESCRIPTION>

<FIELD name="elevation" ID="col1" ucd="pos.cartesian.x" utype="stc:AstroCoords.Position3D.Value3.C1" datatype="float" width="1" unit="degree" />

<FIELD name="values" ID="col2" ucd="pos.cartesian.x" utype="stc:AstroCoords.Position3D.Value3.C1" datatype="float" arraysize="125" width="16" unit="eV cm^-3 s^-1" />

<PARAM name="azimuth" unit="degree" ucd="instr.param" datatype="float" arraysize="125" value="-7.8 -7.6 -7.5 -7.4 -7.3 -7.1 -7 -6.9 -6.8 -6.6 -6.5 -6.4 -6.3 -6.1 -6 -5.9 -5.8 -5.6 -5.5 -5.4 -5.3 -5.1 -5 -4.9 -4.8 -4.6 -4.5 -4.4 -4.3 -4.1 -4 -3.9 -3.8 -3.6 -3.5 -3.4 -3.3 -3.1 -3 -2.9 -2.8 -2.6 -2.5 -2.4 -2.3 -2.1 -2 -1.9 -1.8 -1.6 -1.5 -1.4 -1.3 -1.1 -1 -0.9 -0.8 -0.6 -0.5 -0.4 -0.3 -0.1 -0 0.1 0.2 0.4 0.5 0.6 0.7 0.9 1 1.1 1.2 1.4 1.5 1.6 1.7 1.9 2 2.1 2.2 2.4 2.5 2.6 2.7 2.9 3 3.1 3.2 3.4 3.5 3.6 3.7 3.9 4 4.1 4.2 4.4 4.5 4.6 4.7 4.9 5 5.1 5.2 5.4 5.5 5.6 5.7 5.9 6 6.1 6.2 6.4 6.5 6.6 6.7 6.9 7 7.1 7.2 7.4 7.5 7.6 7.7" />

<DATA>
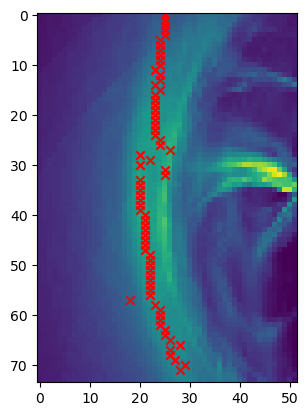
-- The image is not fully restricted by the field of view and the contribution from the cusps is once again important. However in the FOV restricted case this area will not be visible. The main problem is the arc-like contribution close to the magnetopause. Two arcs can be seen in the image, where the outer one is the magnetopause but the inner one is the brightest.
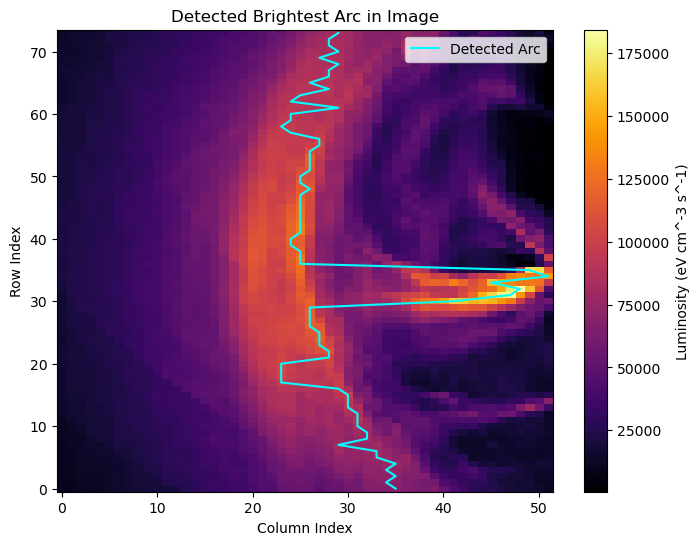
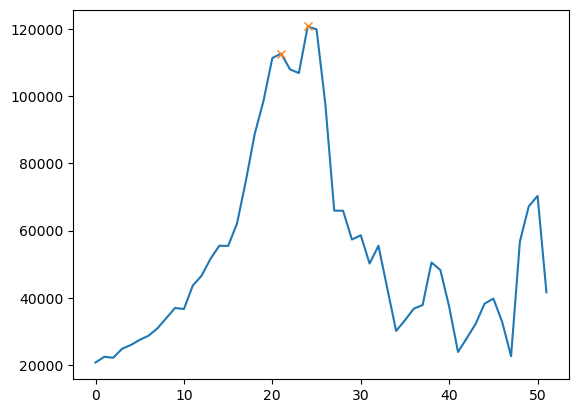
-- To resolve this I tried finding the first local maxima (this is possible in a real case scenario as well since we have attitude knowledge) from the left (sun direction). I used a lower limit of 60% the maximum intensity to avoid small 'bumps' in the intensity. ==> Arc detection
!Pasted image 20250605185912.png