Benchmarking

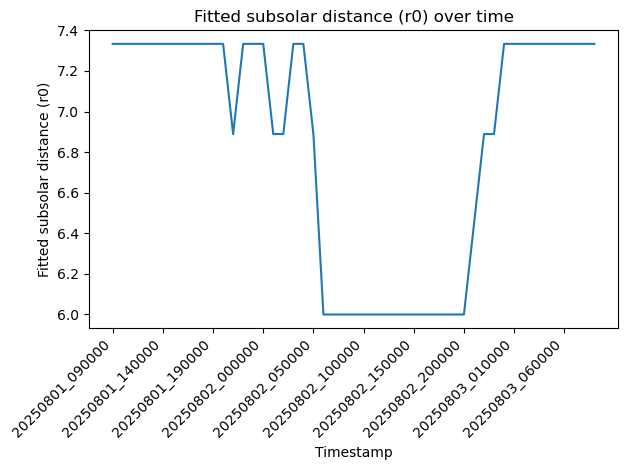
The evolution of r0 with time is shown below:
Pasted image 20250423174939.png|300
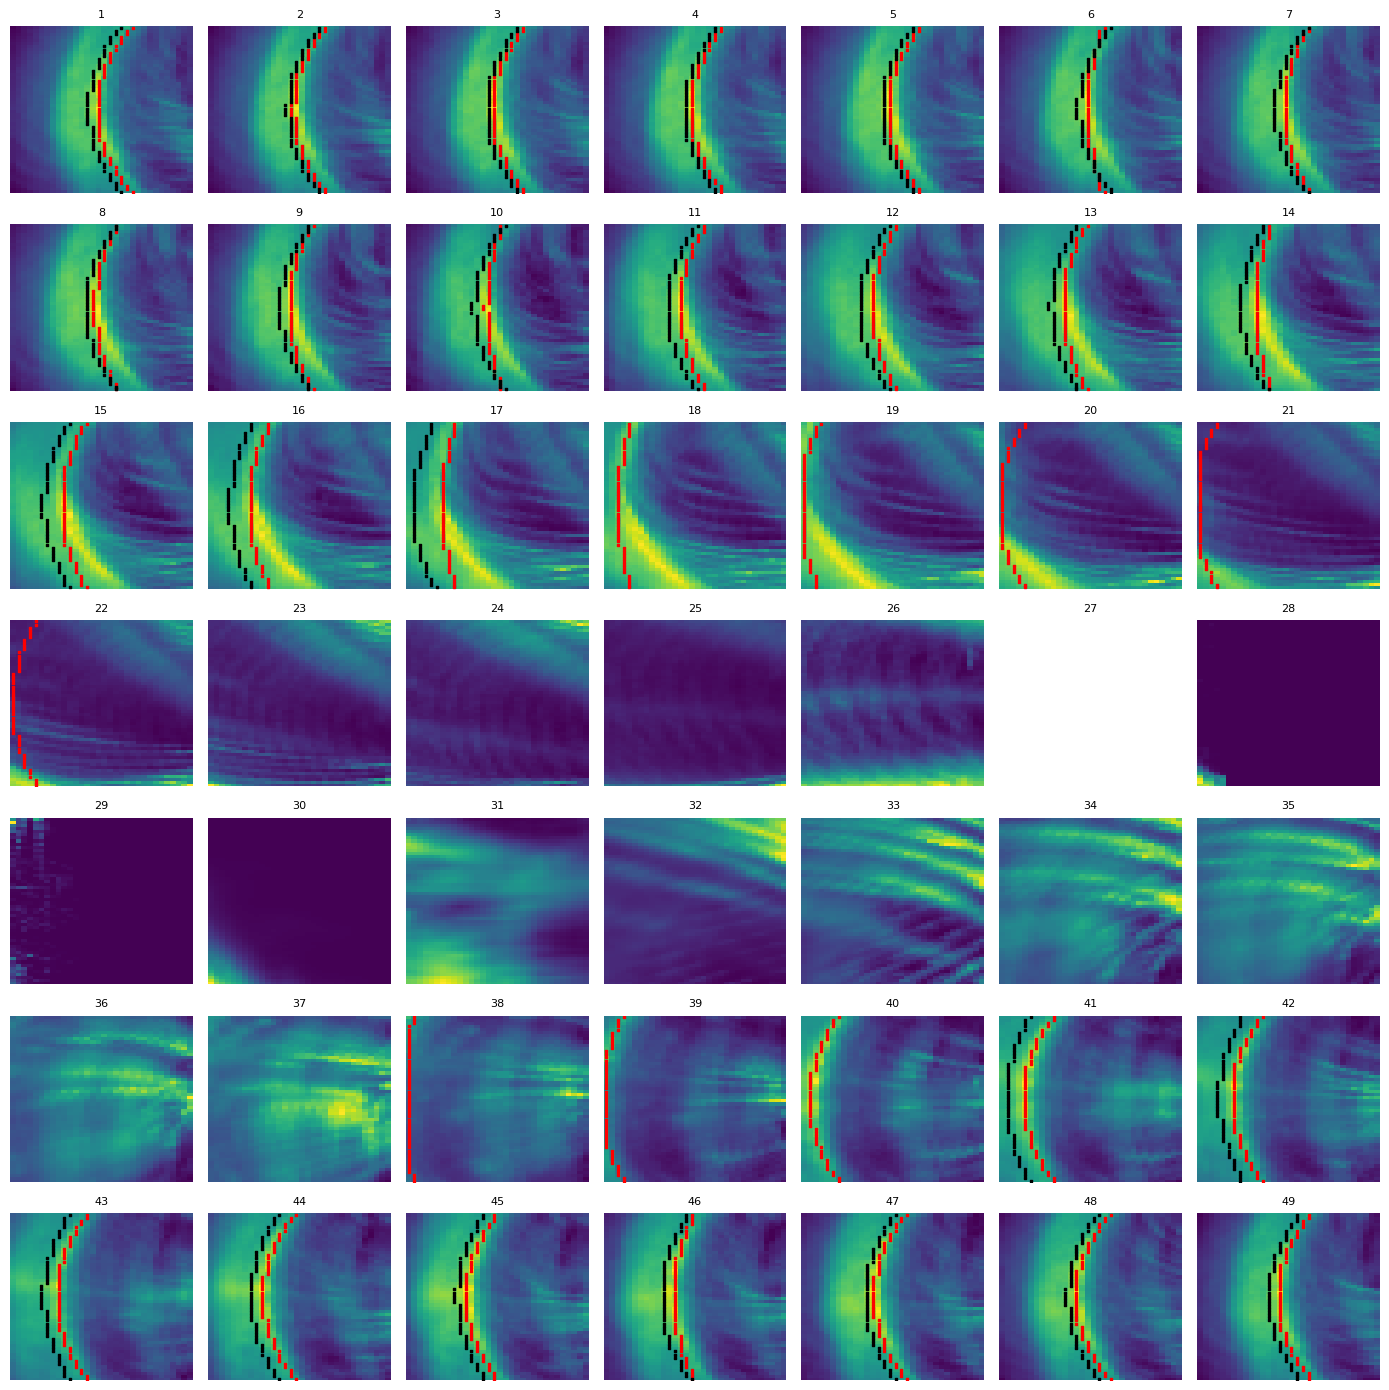
The evolution with the index as well as a well fitted image is show below:
Pasted image 20250423175042.png|400
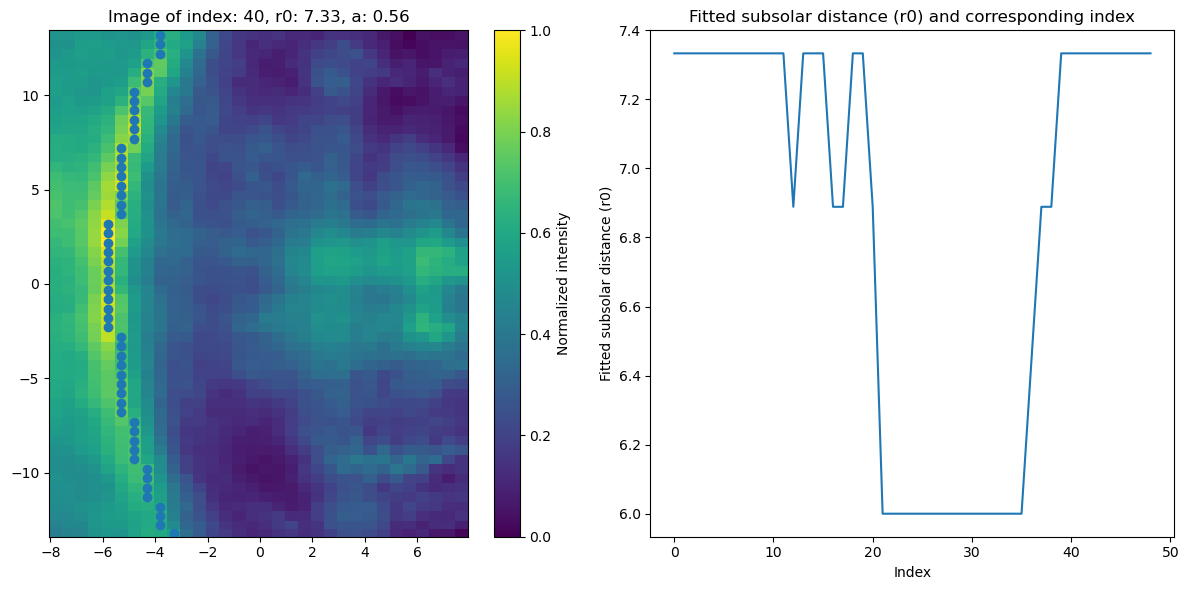
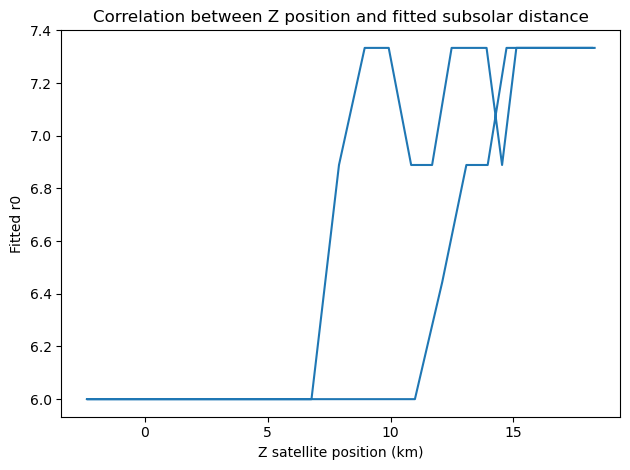
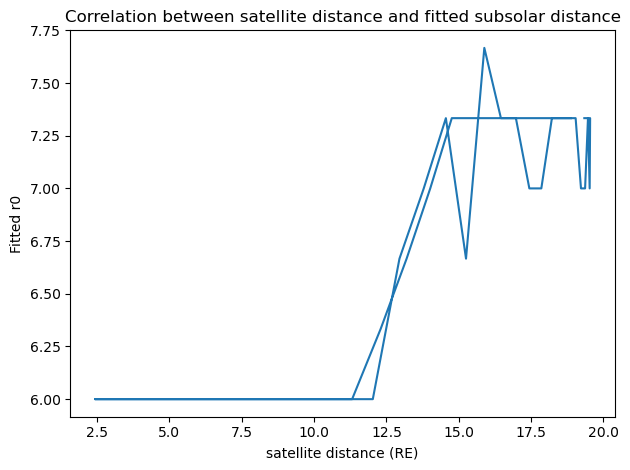
The subsolar distance is steady at 7.33 mostly due to the discretization of the fitting. The correlation with the z coordinate of the satellite position as well as the distance is shown below:
Pasted image 20250423175701.png|300 Pasted image 20250423181155.png|300
Pasted image 20250428132548.png

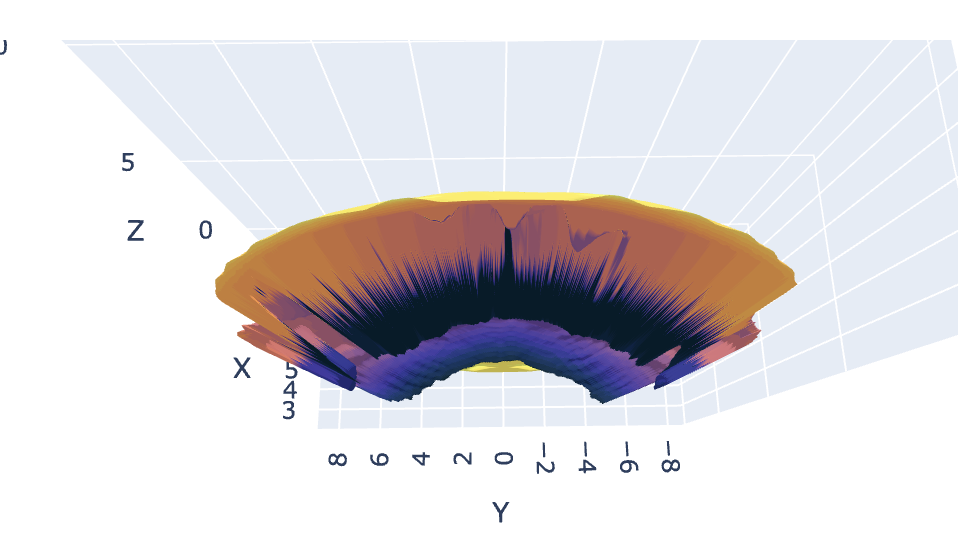
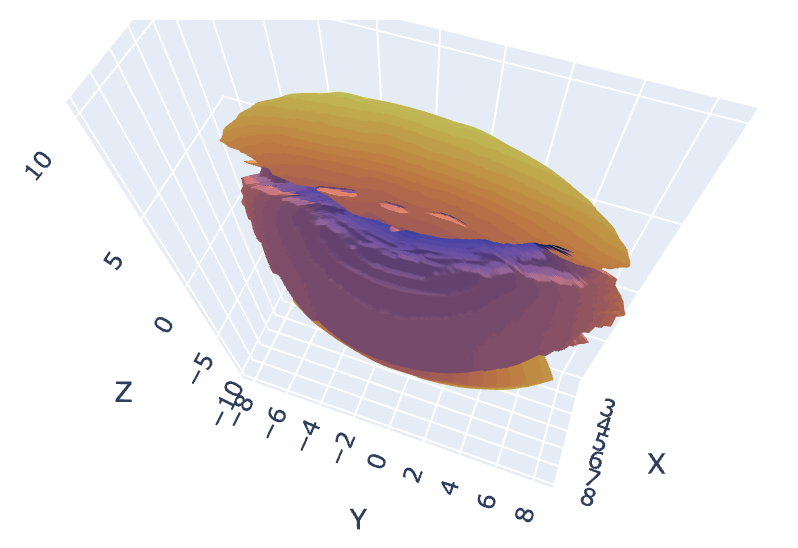
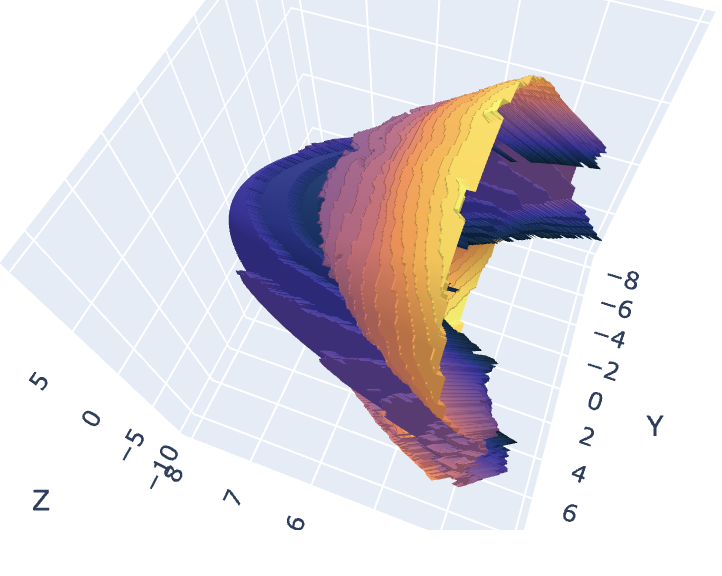
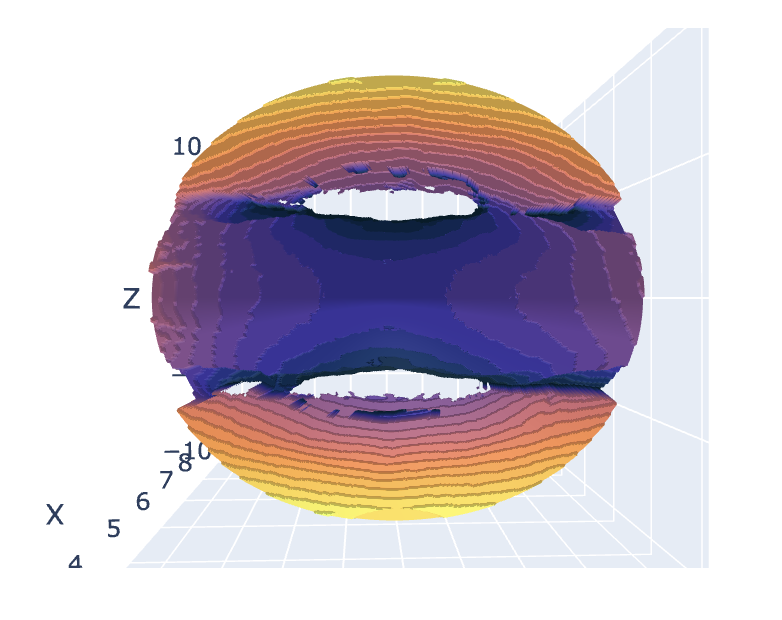
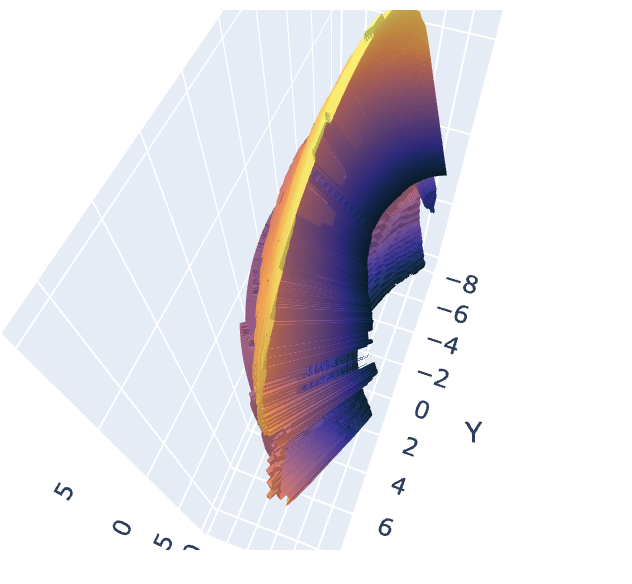
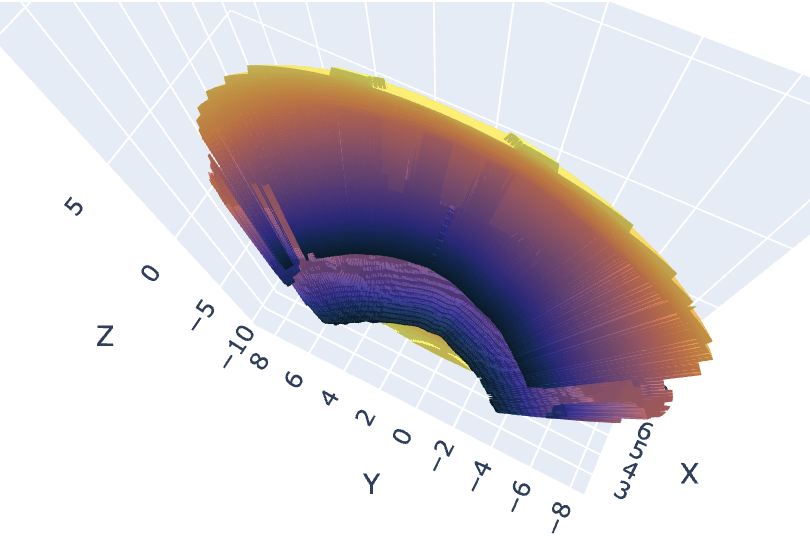
Simulation based characterization

  1. Compare fitted model with simulation fitted model.
  2. Define empirical model for simulation magnetopause
  3. Verify tangent direction hypothesis

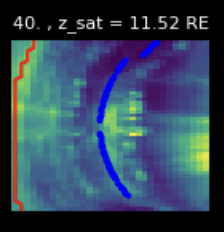
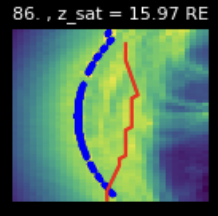
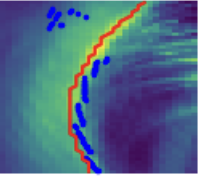
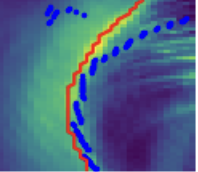
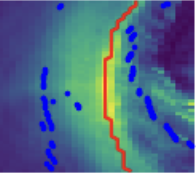
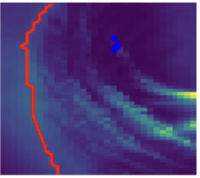
Satellite data benchmarking

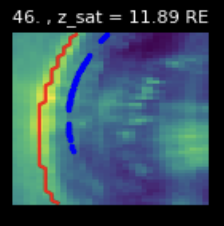
  1. Extract highest intensity arc
  2. Compare with fitted model

Pasted image 20250520151432.png
no orbit data

April

Pasted image 20250602125035.png
Pasted image 20250602125052.png

Pasted image 20250602125147.png Pasted image 20250602125156.png

Pasted image 20250602125255.png Pasted image 20250602125307.png

January

Pasted image 20250602145520.png Pasted image 20250602145530.png Pasted image 20250602145551.png Pasted image 20250602145732.png
Pasted image 20250602145820.png

October

Pasted image 20250602154421.png

Pasted image 20250602154438.png

Pasted image 20250602154700.png Pasted image 20250602154646.png

Pasted image 20250602171402.png

Pasted image 20250602171420.png
Pasted image 20250602171456.png

June

!Pasted image 20250603103254.png
!Pasted image 20250603103343.png